Code
options(scipen=999)

library(tidyverse)
library(rstan)

options(mc.cores = parallel::detectCores())
rstan_options(auto_write = T)options(scipen=999)
library(tidyverse)
library(rstan)
options(mc.cores = parallel::detectCores())
rstan_options(auto_write = T)Decision rules from the Adult Decision Making Competency
ts <- rio::import("https://raw.githubusercontent.com/forecastingresearch/fpt/refs/heads/main/data_cognitive_tasks/task_datasets/data_time_series.csv")

session <- rio::import("https://raw.githubusercontent.com/forecastingresearch/fpt/refs/heads/main/data_cognitive_tasks/metadata_tables/session.csv")

anchoraig_full <- rio::import("https://raw.githubusercontent.com/forecastingresearch/fpt/refs/heads/main/data_cognitive_tasks/metadata_tables/task_aig_version.csv")anchor_ids_anchor <- anchoraig_full %>%
filter(task == "time_series" & AIG_version == "anchor") %>%
pull(session_id)
ts_cl <- ts |>
left_join(session,
by = "session_id") |>
mutate(.by = c(noise_condition, datapoints, func, direction),
ts_id = row_number()) |>
select(subject_id, ts_id, correct = mse)ts_dat <- ts |>
left_join(session,
by = "session_id") |>
filter(session_id %in% anchor_ids_anchor) |>
mutate(.by = c(noise_condition, datapoints, func, direction),
ts_id = cur_group_id()) |>
left_join(rio::import("https://raw.githubusercontent.com/forecastingresearch/fpt/refs/heads/main/data_forecasting/processed_data/scores_quantile.csv") |>
select(subject_id, sscore_standardized) |>
# mean sscores per person
summarize(.by = subject_id,
sscore = mean(sscore_standardized)),
by = "subject_id") |>
select(subject_id, ts_id, score = mse, sscore, noise_condition, datapoints, func, direction)
if (!file.exists(here::here("Data", "Time Series"))) dir.create(here::here("Data", "Time Series"))
saveRDS(ts_dat, here::here("Data", "Time Series", "ts_dat.rds"))test <- readRDS(here::here("Data", "Search Algorithms", "v5test_dat.rds"))
ts_dat <- readRDS(here::here("Data", "Time Series", "ts_dat.rds"))
dat <- ts_dat |>
mutate(item = paste0("ts_", ts_id)) |>
left_join(test |>
filter(task == "ts"),
by = "item") |>
mutate(alg_rank = factor(rep, ordered = T))
# lm(as.numeric(alg_rank) ~ proportion_difference_scaled * small_lottery_gold_prop, dat) |>
# summary()
dat |>
select(alg_rank, noise_condition, datapoints, func, direction) |>
unique() |>
ggplot(aes(y = as.numeric(alg_rank), x = datapoints, color = direction, label = as.numeric(alg_rank))) +
geom_point(position = position_dodge(.5), alpha = 0.3, shape = 16, size = 3) +
geom_text(position = position_dodge(.5)) +
facet_grid(noise_condition ~ func, axes = "all") +
theme_classic() 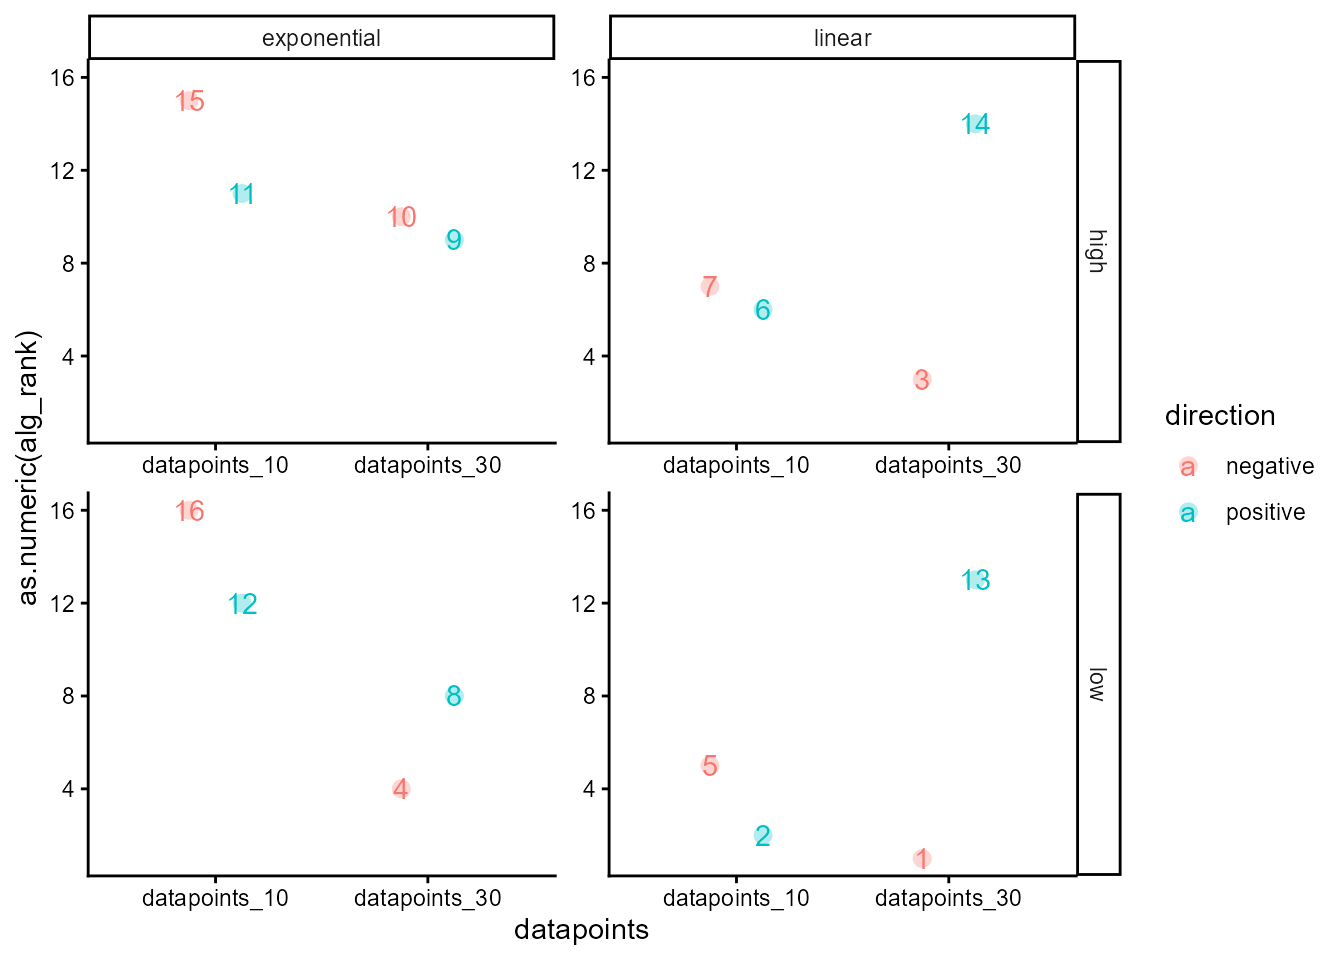
list("noise_condition", "datapoints", "func", "direction") |>
  map(~ lm(as.numeric(alg_rank) ~ noise_condition + datapoints + func + direction, dat) |>
        ggeffects::ggpredict(terms = .x) |>
        plot() +
        labs(title = NULL, x = case_when(.x == "noise_condition" ~ "Noise",
                                         .x == "datapoints" ~ "Datapoints",
                                         .x == "func" ~ "Function",
                                         .x == "direction" ~ "Direction")) +
        coord_cartesian(ylim = c(5, 15)) +
        theme_classic() +
        theme(aspect.ratio = 1)) |>
  patchwork::wrap_plots(nrow = 1)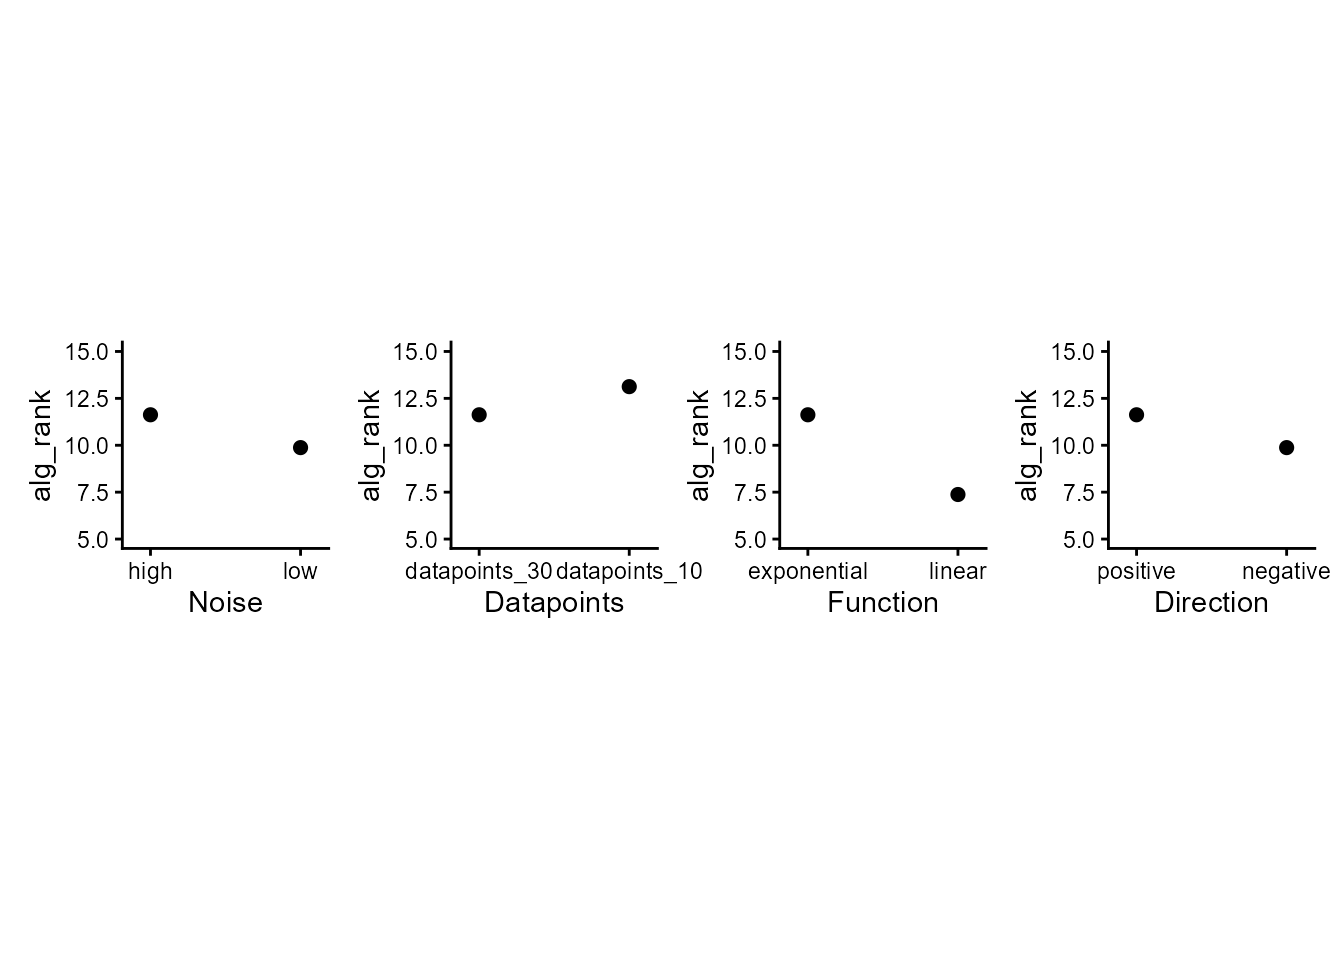
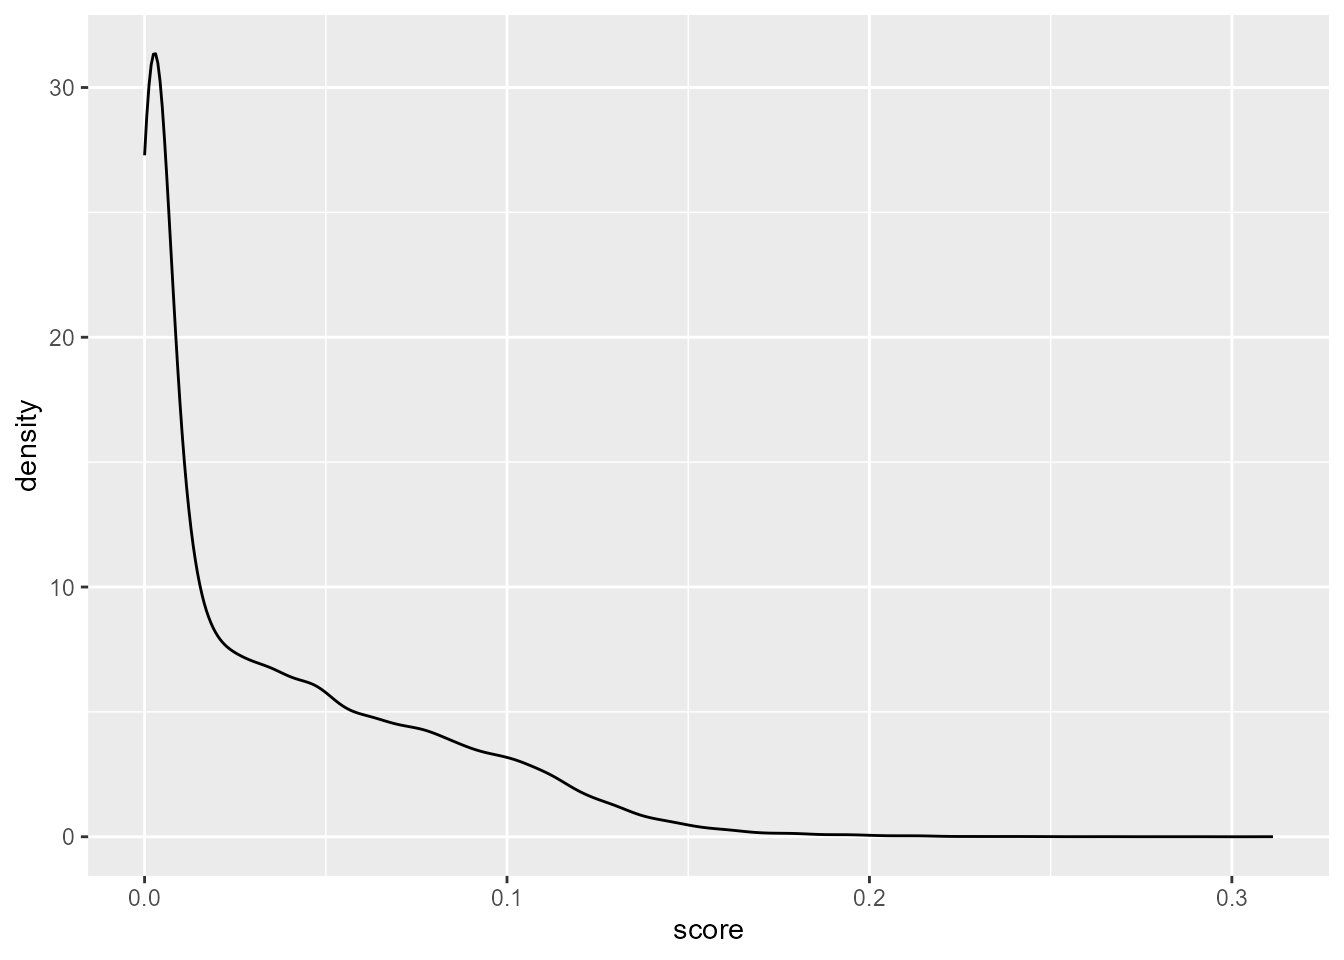
ts_dat |>
  ggplot(aes(x = score)) +
  geom_density(na.rm = T)